Introduction
Modern computers allow users to work simultaneously with a varied number of programs. For example, you can navigate through a lot of websites in your browser while listening to music, working in text editors, and chatting in messengers. Even computers with low physical memory are capable of running several programs at a time, a total allocated memory size of which is larger than the available RAM size.
This is possible since each process has its own virtual address space, and the data is processed to a paging file if there is a lack of RAM. Despite all the benefits of such memory organization, it has a few shortcomings. When RAM is low, and the system is using a paging file heavily, there will likely be a drop in performance, especially on computers with HDD, since the speed of operations with the paging file on this type of disk is much slower than when using SSDs.
The lack of RAM may be caused by bugs in software development (memory leaks). In addition, some programs, accidentally or deliberately, change their parameters so that the system first uploads all other programs to the paging file. We have studied how working with memory and a paging file affects the real performance of computers with different configurations.
How does the memory work?
Before starting our research, we need to understand how Windows deals with memory. This operating system implements paging memory. This way of memory organization involves dividing memory into sections of certain sizes (most commonly 4096 bytes), called pages [1, p. 193], and dividing address spaces into virtual and physical (Figure 1). Virtual address space is defined as memory addresses accessed by a process at runtime. Each process has its own virtual address space. The physical address space, in turn, is the memory address in RAM. This space is common to all processes.
Virtual addresses do not contain data that a process stores or reads; instead, they only indicate where this data is located. For example, when a process records data into memory, it does so by using special functions provided by the operating system. When such functions are called, the virtual address and data for recording are transferred, and the operating system memory manager performs the conversion (translation) of the virtual address into a physical one for further recording to RAM.
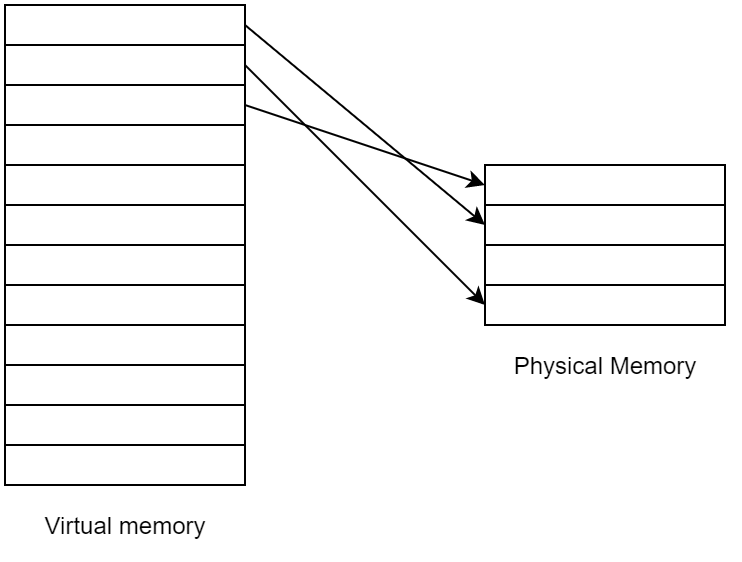
Memory paging allows much more memory to be allocated for each process than the system actually has. This allows many processes that require large amounts of memory to be used in parallel.
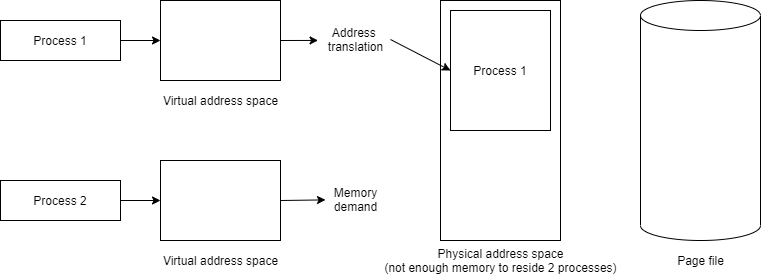
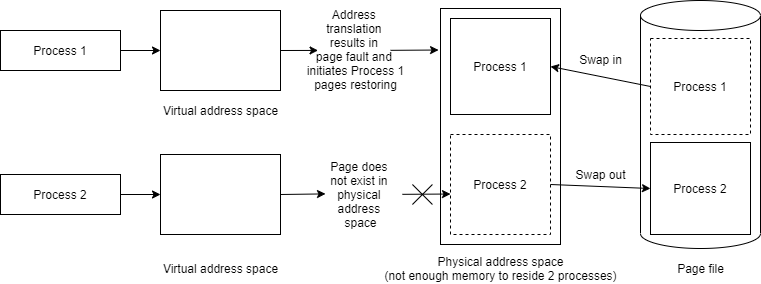
Let’s cover the example shown in Figure 2. The system is running Process 1. The user worked with it for a while and then launched Process 2. In this case, the second process requests memory from the system.
Since there’s not enough RAM to accommodate the data from both processes at the same time, the memory manager dumps unused pages of one process from the physical memory of Process 1 to an external drive to create more space for Process 2 data (Figure 3).
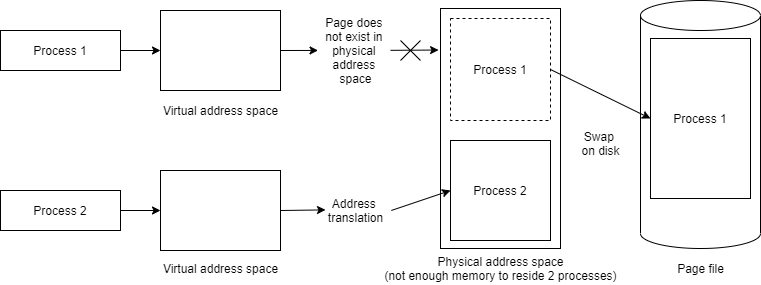
If the user resumes working with Process 1, page faults occur as the process accesses virtual memory addresses, the corresponding physical pages of which have been swapped out to disk [1, p. 267]. In this case, the memory manager starts the process of returning pages to physical memory and unloading Process 2 pages (Figure 4).
The area of virtual memory of a process, the addresses of which can be converted to physical ones without page faults and are not used by other processes , is called a private working set [1, p. 277].
An area of virtual memory allocated to a process that cannot be used by other processes is called Private Bytes. Private Bytes include both Private Working Set pages and pages located in the paging file.
In fact, the process of memory allocation is somewhat more complicated [1, p. 300]. When Process 2 requests memory from the system, the latter first fetches pages from the Free Page List or Zero Page List (see Figure 5). In our case, there is an acute memory shortage, so let’s assume that both lists are empty. In this case, the system starts the process of removing pages from the working set of processes, which is known as trimming.
Each process has a minimum and maximum working set limit. When trimming is running, the Working Set Manager checks the Accessed bit on each page of a working set. The check is carried out in the first place for those processes with working set sizes exceeding the most minimum limit. If a bit is 1 (i.e. the page has been accessed), then the Working Set Manager resets it. If the bit is 0 (that is, the page has not been accessed since the previous Working Set Manager pass), then the Working Set Manager marks that page as a candidate for removal from the working set and increments the number of such pages. When the number of candidates for removal is sufficient to satisfy all memory allocation requests, then the marked pages are removed from the working set.
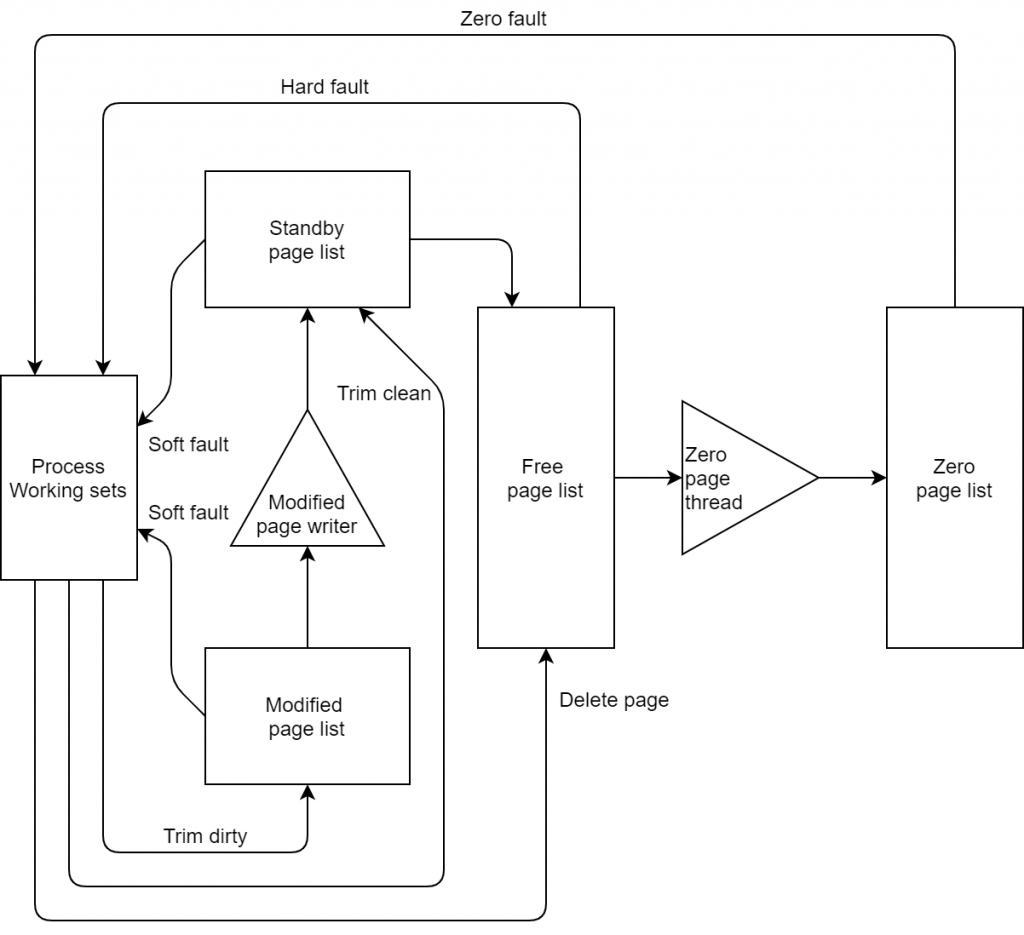
All of these lists are located in RAM, so while the page is in the Modified Page List or Standby Page List, the process from which the page was unloaded can request it again. In this case, a Soft Page Fault will occur. These exceptions do not cause a drop in performance since the pages are still in RAM and restoring pages in the Working Set doesn’t require much time. If the page is no longer in the Standby Page List or Modified Page List, then when the page’s data is requested, a Hard Page Fault will occur, and the system will have to restore the page from disk, while the performance of disks (even SSDs) is much lower than the performance of RAM.
If both processes are actively using memory, the process of simultaneously unloading pages to disk and loading pages from it will occur continuously. This leads to a large number of Hard Page Faults, and since the operating system is forced to provide requests to physical addresses from all processes, then a part of the processor time is spent on processing such page faults. This can lead to a state where the CPU is processing Hard Page Faults most of the time instead of doing “useful” work. This phenomenon is called memory trashing. A slip can be diagnosed in Performance Monitor using the Page Faults/sec, Page Input/sec, Page Output/sec, and % Processor Time performance counters.
The Experiments
In order to understand the specific situations under which performance problems caused by insufficient memory allocation occur, we have conducted several experiments.
Experiment 1
The first experiment was carried out on the computers with the following configuration:
- AMD Ryzen 3500U (4 cores, 8 threads, 2.1 GHz), RAM: 14.9 GB, Disk: SSD 512 GB.
- AMD A8-7050 Radeon R5 (2 cores, 2 threads, 2.2 GHz), RAM: 7 GB, Disk: HDD 1 TB.
- Intel Core i5-7200U (2 cores, 4 threads, 2.5 GHz), RAM: 7.9 GB, Disk: SSD 256 GB.
This experiment included developing a couple of tools that simulate programs using large amounts of memory:
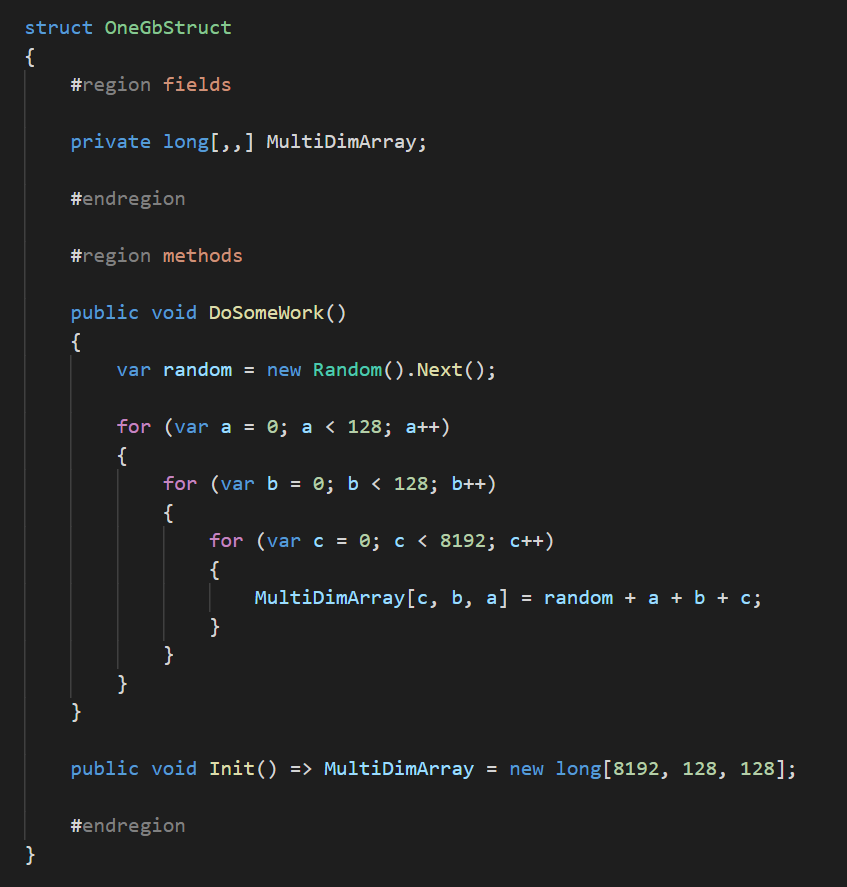
- Tool 1 at startup creates a structure with a 1 GB array (Figure 6). If required, it’s possible to change the MultiDimArray using the DoSomeWork method. Since the algorithm of the DoSomeWork method doesn’t change during all tests, the impact on performance can be determined by the duration of its execution.
- Tool 2 periodically requests large amounts of memory and then frees them afterward.
The test was conducted as follows:
- Frist both tools were launched.
- Tool 2 requested a certain amount of memory, after which Tool 1 launched the DoSomeWork method.
- Then the test was repeated. Tool 2 increased the requested amount of memory with each test iteration.
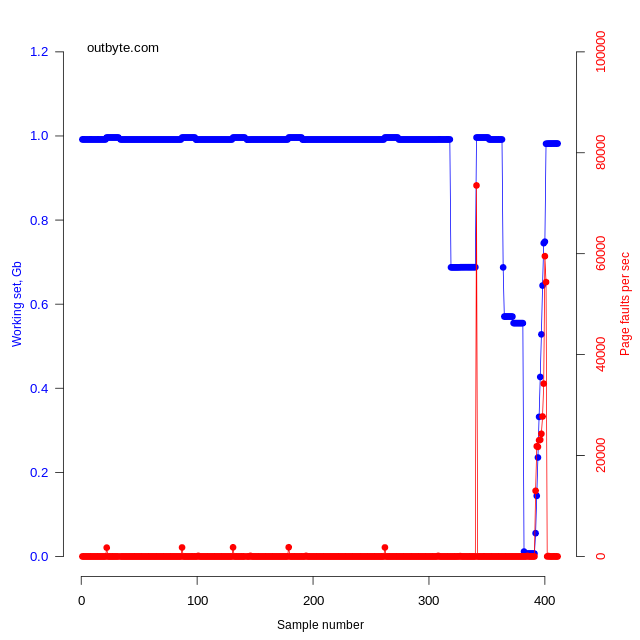
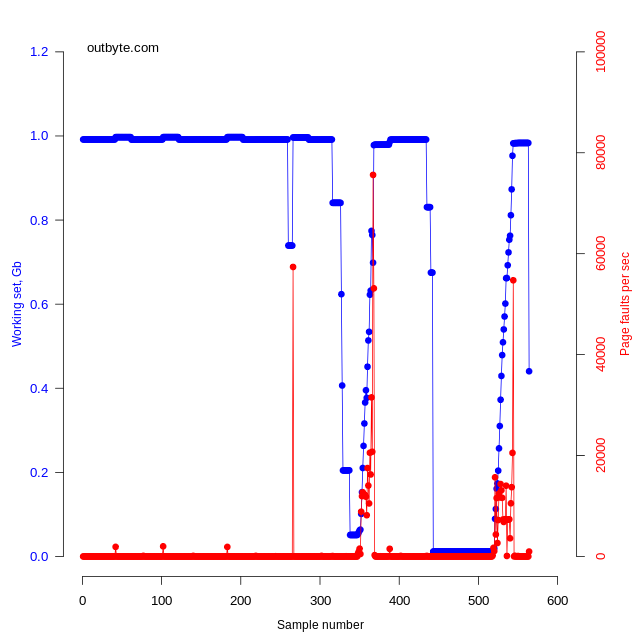
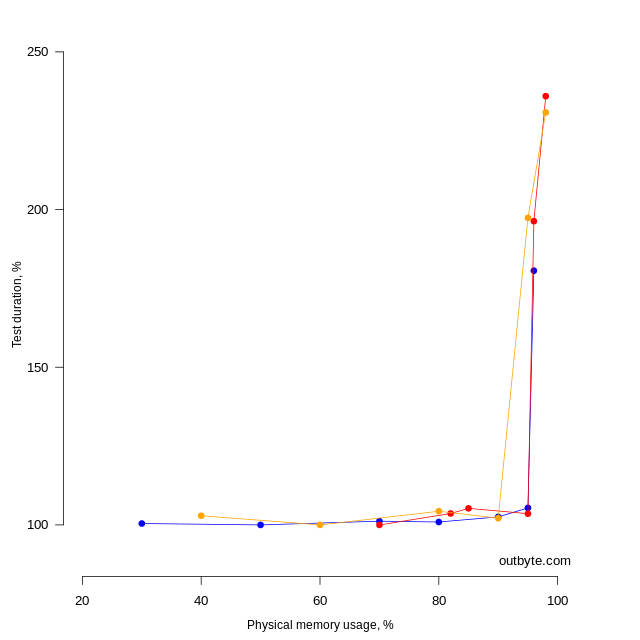
As Figure 7 demonstrates, at the end of the experiment, when the memory was almost 100% full, pages were unloaded from the working set of Tool 1 on all PCs (the Working Set decreased to 0), and then a complete recovery occurred (the array elements were changed). This led to an increase in the number of page faults (Figure 8), which, in turn, caused an increase in test time (Figures 9 and 10).
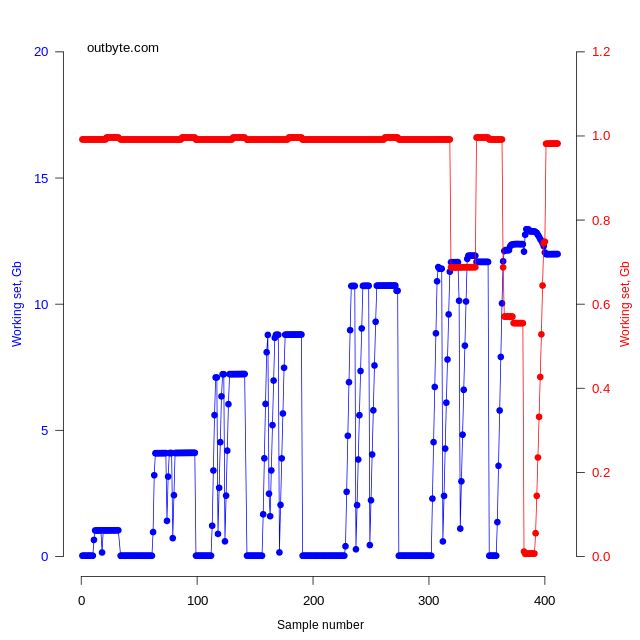
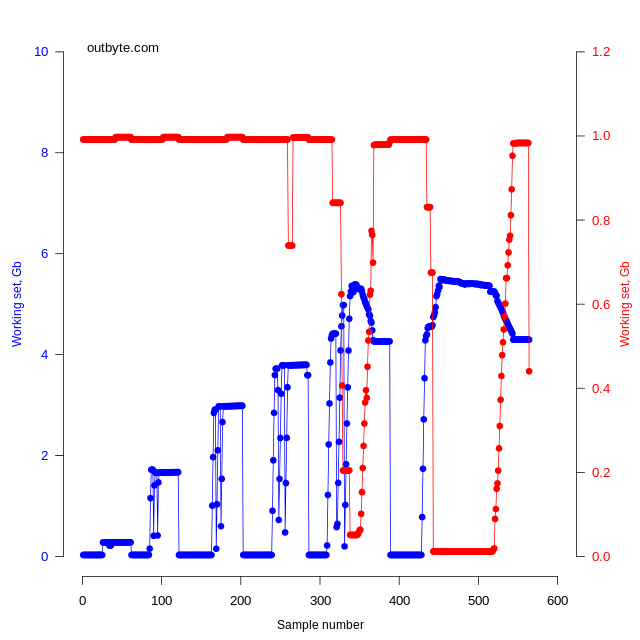
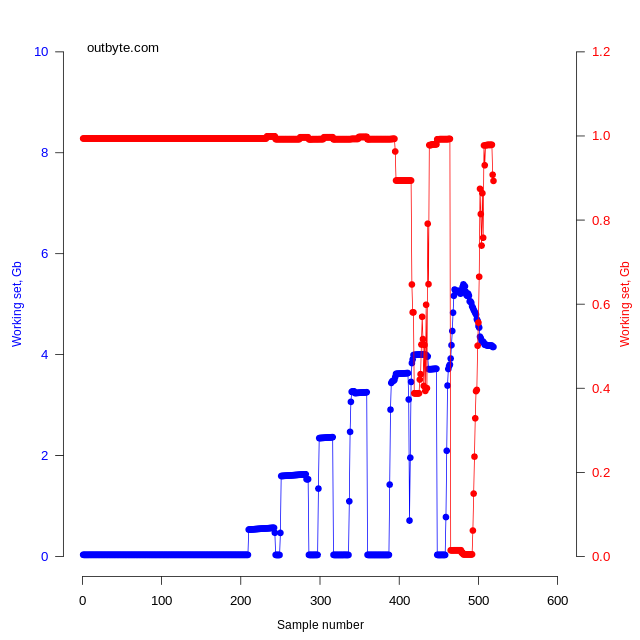
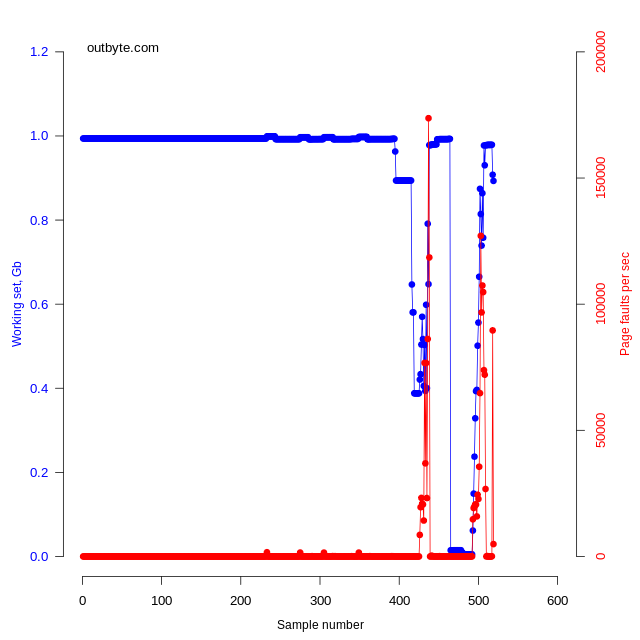
Orange graph – PC 3 (Intel).
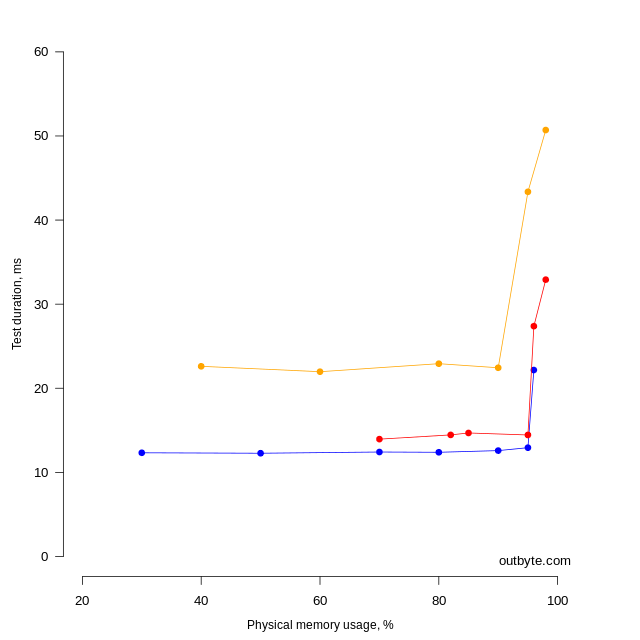
Figures 9 and 10 demonstrate that the relative test results are similar, yet they differ in absolute units, which can be explained by hardware differences.
Experiment 2
- Process A. Occupies 1 GB. Memory is allocated with the VirtualAlloc function [2]. It is possible to block personal memory areas from being unloaded using the VirtualLock function [3]. Unlocking is performed by the VirtualUnlock function [4].
- Process B. Occupies 1 GB. Memory is always allocated in the way of creating an array of numbers.
- Process C. Periodically shrinks and enlarges its working set, thereby affecting free memory volume. It provokes the unloading of working sets of other processes into a paging file.
As the graphs demonstrate (Figure 11), Process A was swapped out, yet this happened much later than with Process B. This is due to the change in the minimum working set limit of the process (MinWorkingSetSize). Since the VirtualLock function cannot lock the number of pages exceeding MinWorkingSetSize (which is 8 pages), this limit was increased in order to lock 1 GB of memory. Changing MinWorkingSetSize, in turn, affects the Working Set Manager because it first removes pages from working sets that exceed their MinWorkingSetSize values. If the VirtualUnlock function isn’t called, it will prevent the Process A working set from being swapped out.
Conclusion
Experiments have shown that the lack of physical memory can slow down the performance of the operating system. This can be caused by both hardware limitations and software development errors.
An effective strategy for computer optimization tools can be based on detecting processes with a modified minimum working set limit. It’s also possible to track memory slip using the performance counters Page Faults/sec, Page Input/sec, Page Output/sec, and % Processor Time, and then reducing affinity and priority for processes that have caused the slip. This will not increase the speed of such applications but will set system resources free for other tasks.
Sources
- Windows Internals, Part 2 (6th edition), 2012
- https://docs.microsoft.com/en-us/windows/win32/api/memoryapi/nf-memoryapi-virtualalloc
- https://docs.microsoft.com/en-us/windows/win32/api/memoryapi/nf-memoryapi-virtuallock
- https://docs.microsoft.com/en-us/windows/win32/api/memoryapi/nf-memoryapi-virtualunlock