CPU and PC performance
While issues with Windows performance have always existed, they have gradually improved in the years since Windows Vista was released. However, troubleshooting and resolving these issues remains a task that all computer users have to deal with every once in a while. This is often caused by system resources being overwhelmed and failing to keep up with the demand of the software being run. Some programs and processes are more likely to cause problems than others. A poorly written app can lock up when it fails to access the Internet, video processing software can use up all available memory and an antivirus with an inefficient file caching mechanism can end up scanning every single file every time it is accessed. Sometimes, a resource-intensive process may have a runaway thread that consumes all of the processing power of the CPU, causing the whole PC to be stuck (also known as being CPU-bound) [1, p. 510]. There are many factors that determine how these “greedy” processes affect the whole system such as processor affinity, the number of threads being run, their priorities, etc. In this article we investigate how these variables affect the performance of computers running one or more CPU-bound threads.
Processes and Threads
In Microsoft terms, every application has one or more processes, also called executing programs, associated with it. In turn, every process consists of one of more threads, and it is these threads that get CPU time allotted. Each thread carries out a part of a program’s code and multiple threads can run simultaneously. On any computer, there are dozens of threads running in parallel at any given moment. This is possible thanks to the Windows kernel scheduler that assigns short time intervals for each thread to run on an available CPU and then switches between these threads as needed (Figure 1). Each thread is given a different quantum (timeline), depending on the system. For consumer Windows versions it is usually 2 clock intervals, while for Windows servers it is 12 clock intervals. Clock intervals also can vary from 10ms on a x86 single core processor to 15ms on most x86 and x64 multiprocessors.
Since it switches between multiple threads, the CPU must save the local data of the previous thread and load the data of the next thread. The context switch overhead means quanta cannot be too short. However, they also need to be short enough to prevent issues such as UI being unresponsive, audio stuttering or other similar issues.
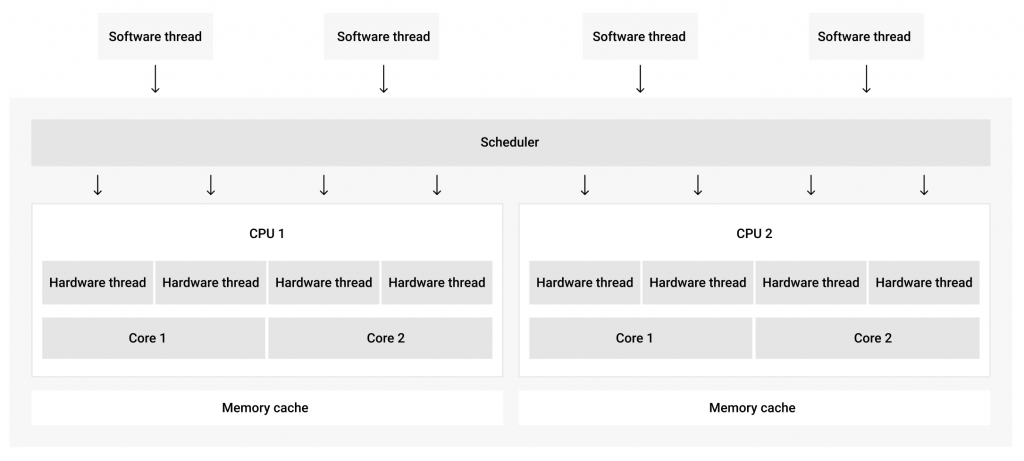
How often a thread is allowed to run depends on the quantity of available CPUs, the quantity of threads as well as the priority of the thread set by the kernel scheduler. The CPUs are a limited resource, so the scheduler queues up threads to be executed on each available thread and prioritizes them to determine which ones get in first. A thread that is already running can be preempted (replaced) by a different thread with higher priority. A thread’s dynamic priority is determined by its priority class and its relative priority.
Also, it can be given a boost in priority in certain cases to prevent CPU starvation and ensure a smooth UI experience. On a multiprocessor computer, a thread may be run on multiple CPUs. Whether this can be done depends on the processor affinity of the thread. One with an affinity for a single processor can only be run on that particular processor.
Method
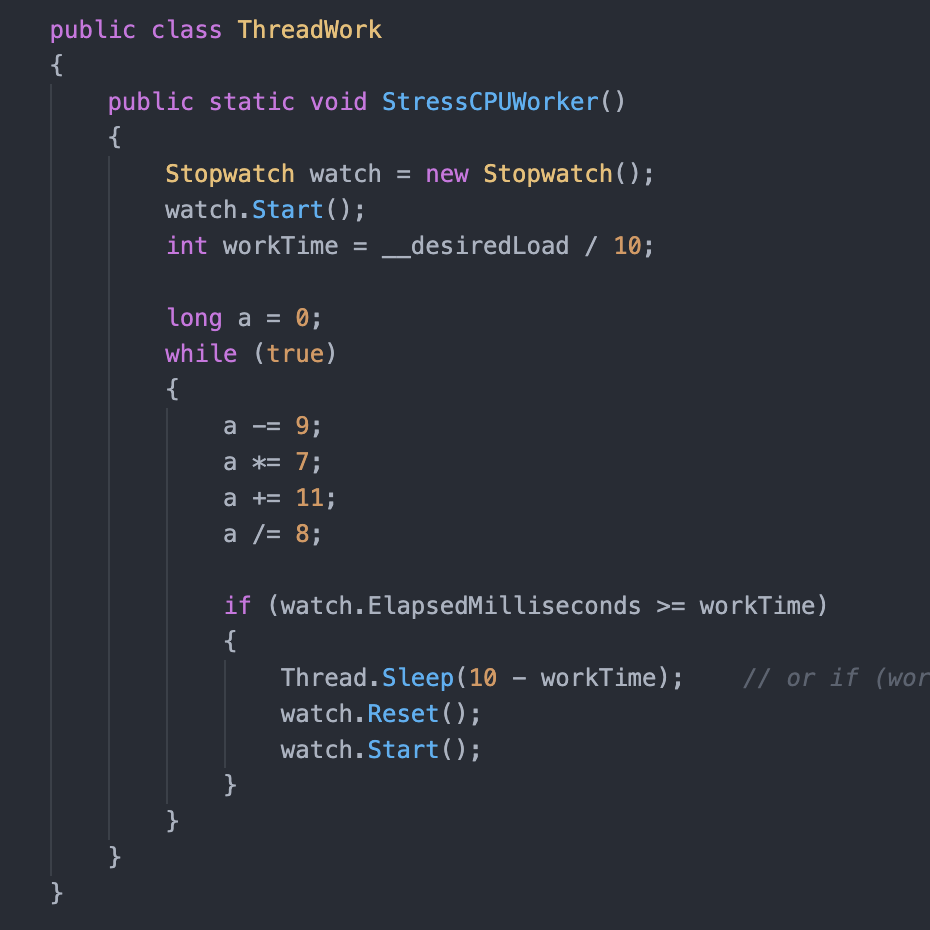
To test as many scenarios as possible, we created a program that would stress test the CPU with a process that contained a number of CPU-intensive threads. This process was then run with different priority classes, processor affinities and variable per-CPU load targets. In one of the experiments, we used a dual-core Intel system with hyperthreading. This effectively exposed four logical processors. We ran a process with 1 to 8 threads, 6 priority classes from IDLE_PRIORITY_CLASS to REALTIME_PRIORITY_CLASS, limiting the threads to a single logical processor or not limiting them at all, and a per-CPU load target varying from 0 to 100% in 10% increments. This resulted in 1056 tests in total. Simple arithmetic commands were used to stress the CPUs. A controlled load per logical CPU was created by putting the thread to sleep for an appropriate fraction of time.
As a measure of real-time system performance, we used the time from issuing a command that would launch Notepad and until the app loaded its window. We also gave the threads 10 seconds to kick in before launching Notepad. To make sure memory caching did not affect our results, we launched the app 10 times. Then, we launched Notepad 20 more times and calculated the average time over those 20 launches.
For this experiment, the tests were run on virtual Windows PCs as well as a few physical PCs, all with Windows 10 installed. We will cover the results we acquired using computers with the following configuration:
- Amazon workspaces virtual machine, Intel(R) Xeon(R) Platinum 8259CL CPU @ 2.50GHz, 2500 Mhz, 2 Core(s), 4 Logical Processor(s); 16 GB RAM.
- Intel(R) Xeon(R) Platinum 8259CL CPU @ 2.50GHz, 2500 Mhz, 2 Core(s), 4 Logical Processor(s); 16 GB RAM.
It is important to note that Amazon Workspaces use SSD drives, allowing for relatively fast memory swapping in comparison with computers with slower HDDs [2, p. 73].
Since our CPU-bound threads did not use memory and we launched Notepad a few times before measuring our results, the type of data storage used should not make a significant difference.
Results
It took over 10 hours to run the 1056 tests for this experiment. The CSV file can be downloaded from our server. When looking at the data, keep in mind that the “CPU load” values are per-CPU load targets of each thread, not the combined CPU load you would find in Task Manager. Meaning that a CPU load of 50% is a particular thread using a single logical processor about 50% of the time.
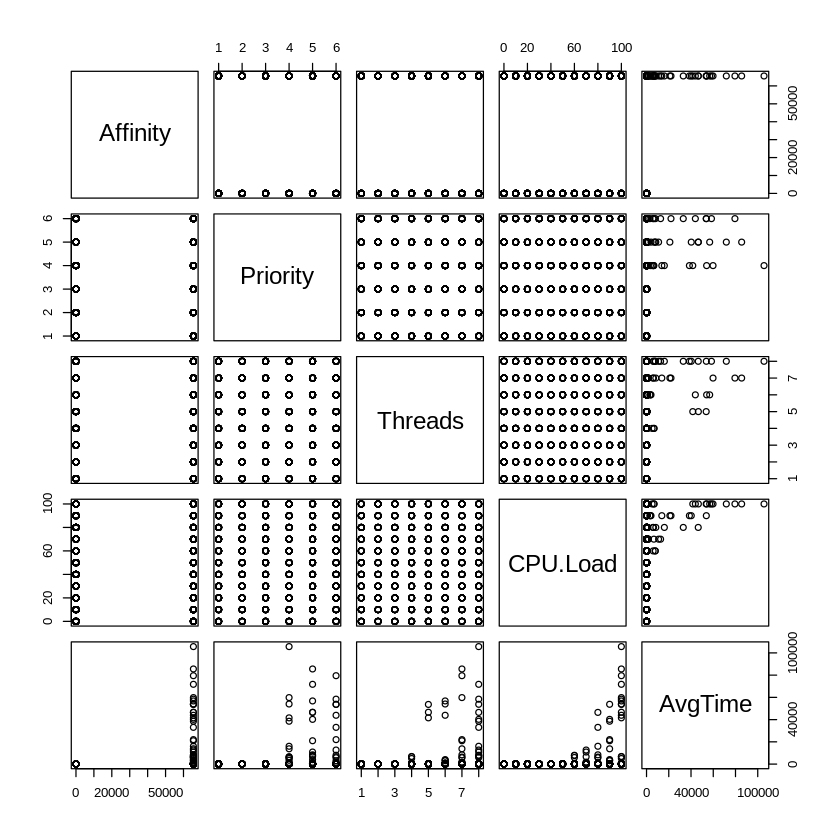
In figure 3, you can see the correlation graph obtained in R that gives an overview of the results. Looking at the bottom row, you can see that the maximum total CPU load generated by a single thread running at full throttle was 100% / # of logical processors [1]. Since this was a 4 logical CPU system, it means this single “greedy” thread was only using up to 25% of the overall CPU capacity of the system. Running this thread at 100% throttle, we found 25% utilization in all four logical processors. You can also see in the graph that the average time it took to start up Notepad.exe rapidly goes up as the number of threads increases, starting with four threads.
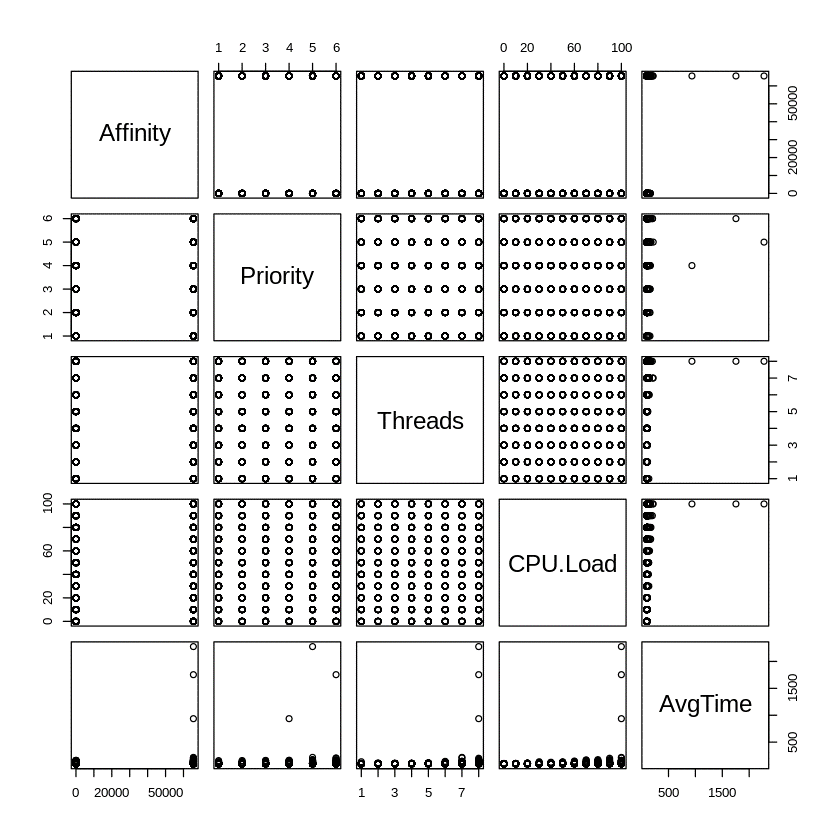
Running this test on a computer with 8 logical cores resulted in a slightly different situation (Figure 4). Here, the number of logical cores matched the maximum number of threads used in our test. This resulted in a significant delay in launching Notepad only during a 100% load with threads that have an affinity of 0xFFF and a priority type Above Normal or higher.
As expected, the average launch time increased exponentially as the CPU load per thread approached 100%. The decrease in speed became noticeable at around 60% CPU load. However, this also depends on many other factors such as the priority of the process, the number of threads and the affinity of the processor.
Surprisingly, the system’s processing speed suffered even when our CPU-bound threads were set as IDLE_PRIORITY_CLASS (Figure 5). When running threads at 90-100% CPU load, the average launch time doubled or even tripled. This is significant enough to be noticed by most users. However there was a minor difference in the impact on performance between a process with threads constrained to a single CPU (via an affinity mask) and an unconstrained one.
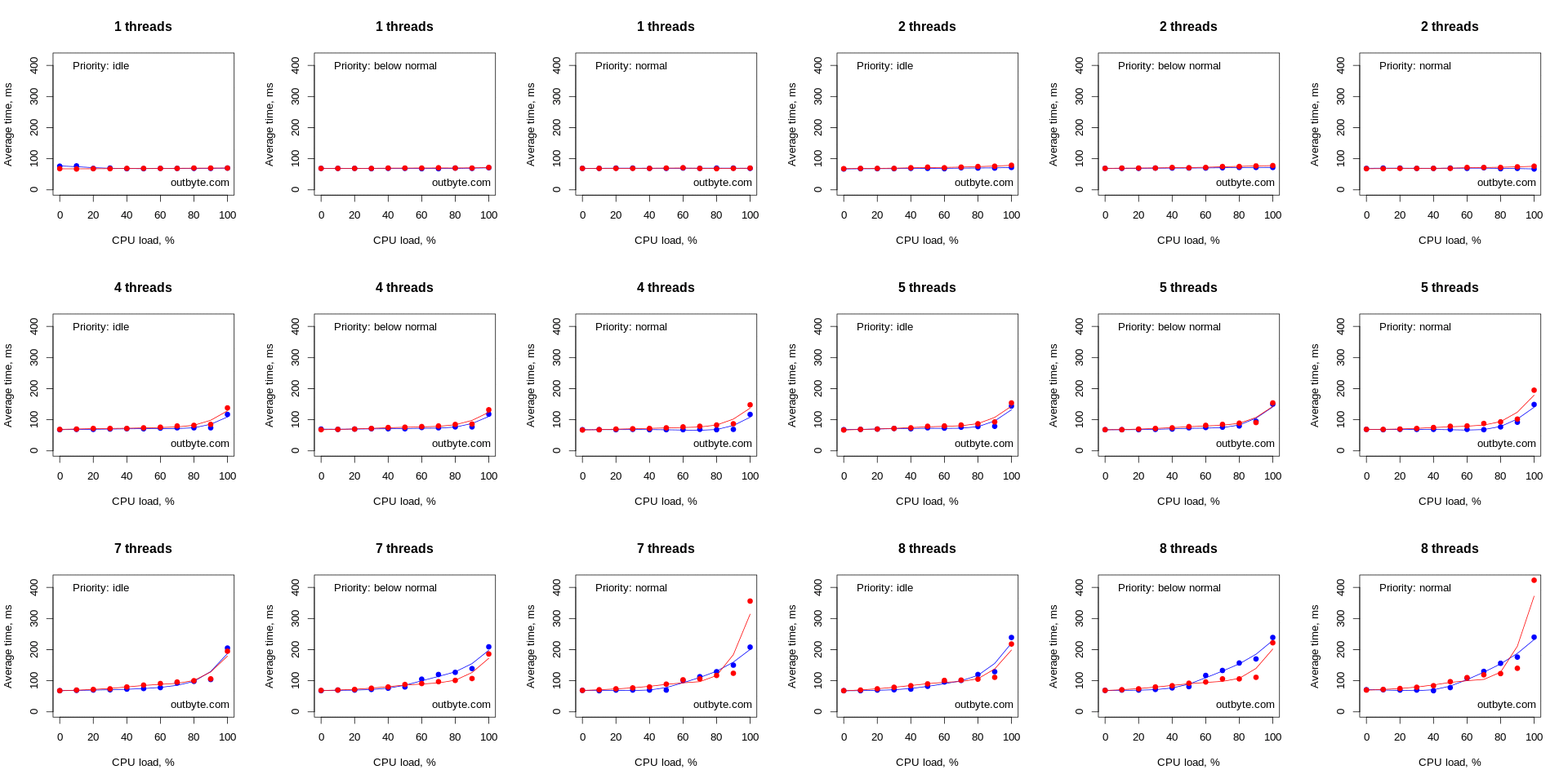
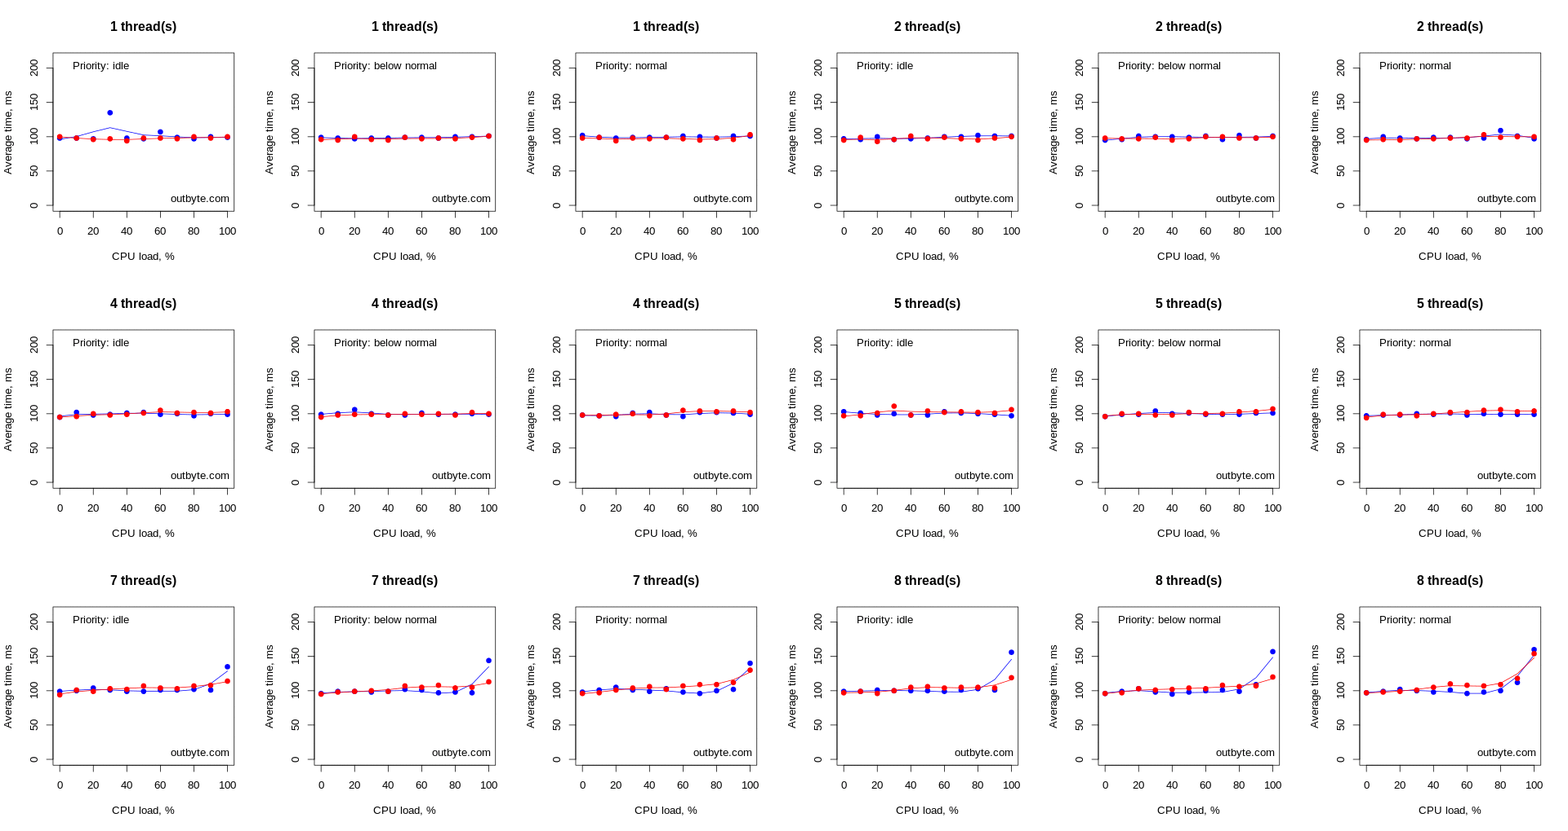
Threads that had IDLE_PRIORITY_CLASS and NORMAL_PRIORITY_CLASS priority types didn’t affect the physical computers that much. The launch time for Notepad didn’t increase by more than 50% (Figure 6).
However, with processes with priority classes above NORMAL_PRIORITY_CLASS, things looked very different, especially for the virtual machines (Figure 7). In these cases, threads unconstrained to a single CPU had a dramatic effect on system performance, increasing the average start time from less than 0.1 seconds to 80 seconds. Notepad.exe was still able to launch despite 8 threads running at 100% CPU intensity in a REALTIME_PRIORITY_CLASS process.
While Windows always schedules higher priority threads to run first and replaces a lower priority thread if a higher priority thread appears, any thread can enter a waiting state voluntarily or, for example, due to the system resolving a paging I/O and thus yield CPU to another thread. Windows will also boost the priority of some threads for applications running in the foreground as well as occasionally boost low-priority threads to avoid CPU starvation and priority inversion scenarios [3, pp. 411-447]. However, this temporary boost happens rarely and very briefly.
In our case, the reason Notepad.exe was able to launch was due to our CPU-bound threads still calling the Sleep(0) function at 100% per-CPU load target (Figure 2). This function allowed Windows to run other threads. When we removed Sleep altogether while running four or more threads with above-normal priority, the computer became completely unresponsive.
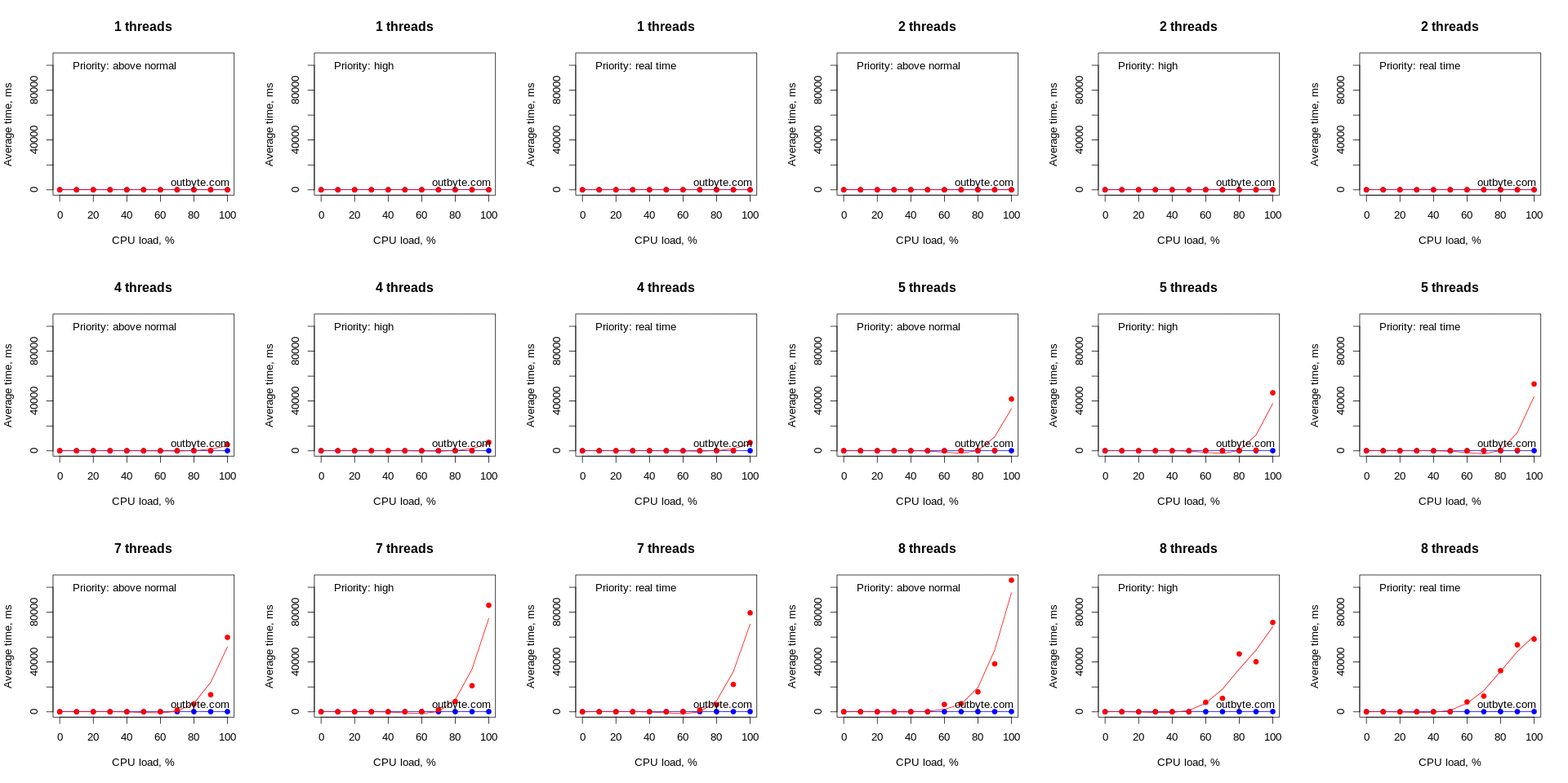
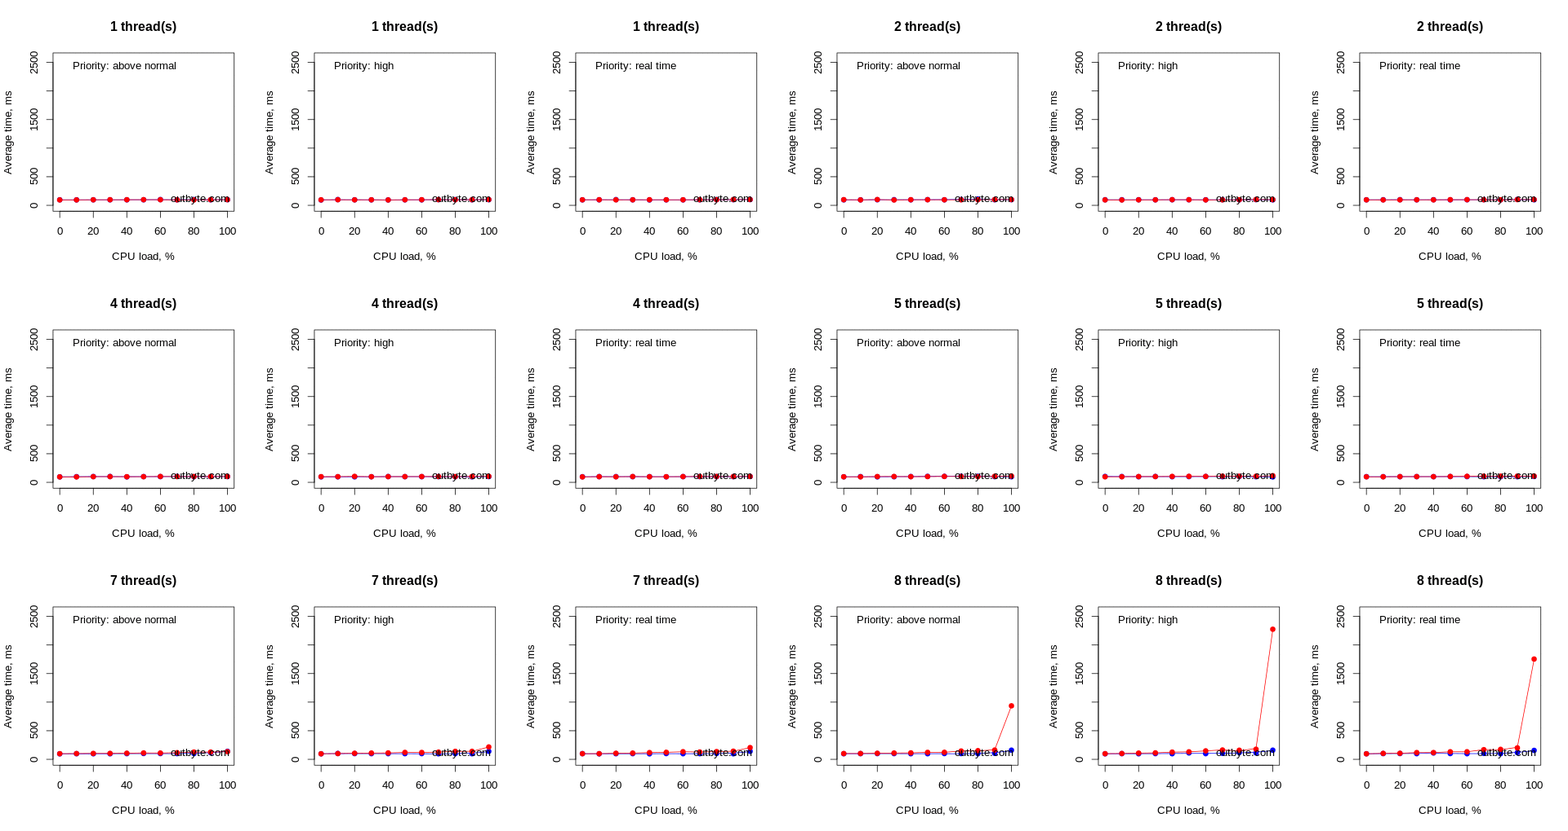
When one or all threads (say, running at 90%) are restricted to a single CPU, we expect that only that particular CPU should be occupied, leaving the other ones available and therefore not having a significant impact on system performance. However, as seen in Figure 9, the performance hit was very significant in practice and grew with the number of threads but only when more than four of our CPU-intensive threads were present. When the threads were unrestricted to a particular CPU, the performance hit was linear and less significant (at least for this particular per-CPU load target of 90%).
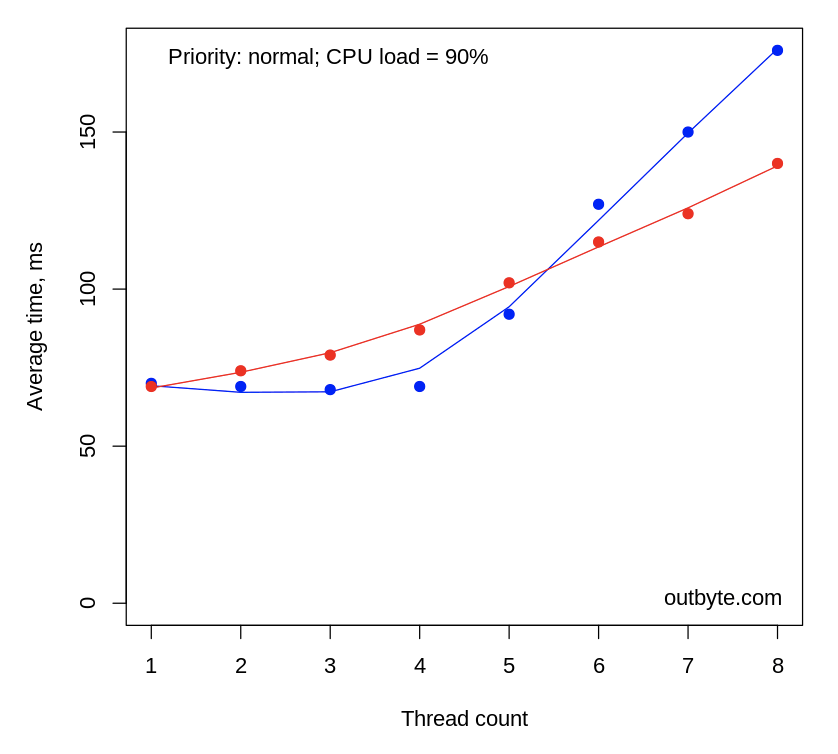
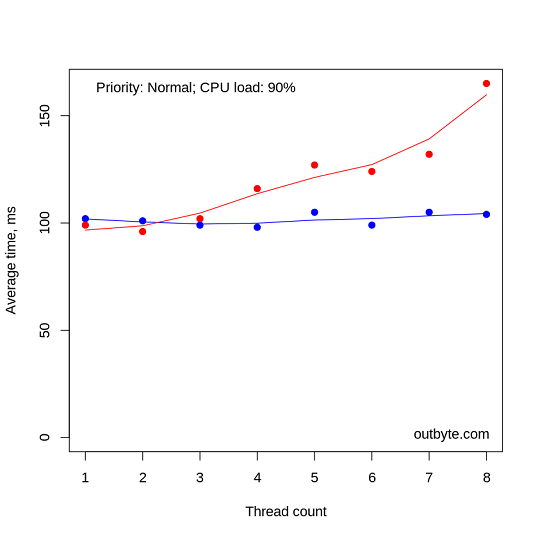
Based on the data we gathered, it is recommended that software developers ensure that the priority of their processes and threads are not set to be above normal unless it is a time-critical process. Even in these cases, the priority should be dropped back down to normal once the time-critical part is dealt with. Threads that perform lengthy calculations and therefore do not have a chance to yield execution should be used sparingly. This is less of an issue now that most if not all computers feature multiple processors [4]. Applications that take advantage of multiple CPUs at the very least need to drop the priority of their resource-intensive threads below normal.
Computer optimization tools can potentially utilize this as a strategy by detecting CPU-bound threads with normal or above normal base priorities and subsequently restricting the processor affinity and/or reducing the priority of the process running these threads. Of course, this may affect time-critical applications. While this may not be an issue for a regular computer user (e.g. a music player working in the background may stutter, etc.), this can have devastating consequences in other time-critical equipment; for example, those used in health care.
It is also important to note that changing the processor affinity or the priority of an application whose threads are not CPU-bound or occupy fewer logical CPUs than are available is not likely to significantly improve system performance.
Further research is needed to investigate how CPU-intensive processes affect other aspects of system performance such as rendering the UI, responsiveness to user input such as mouse or keyboard, file operations, browsing experience, and so on. Stressing CPUs with various types of tasks, e.g. fast Fourier transform routines may be explored, as well as using machine language to ensure specific instructions (e.g., floating-point instructions, CLMUL, etc.) are being tested.
How to speed up processes
As described, the speed at which programs run can depend on their priority level. By default, Windows gives higher priority to all system processes and normal priority to all other apps. However, there are ways to “cheat” this to make the CPU focus on the programs you want to prioritize. This won’t make your whole PC “faster”, but it definitely can make processes run faster and smoother. This effect is especially noticeable with multi-threaded applications such as web browsers, word processors, or web servers.
In order to achieve this, you can try using tools designed for this function. We tested this with the new Speed Booster tool in Outbyte PC Repair.
Testing Speed Booster
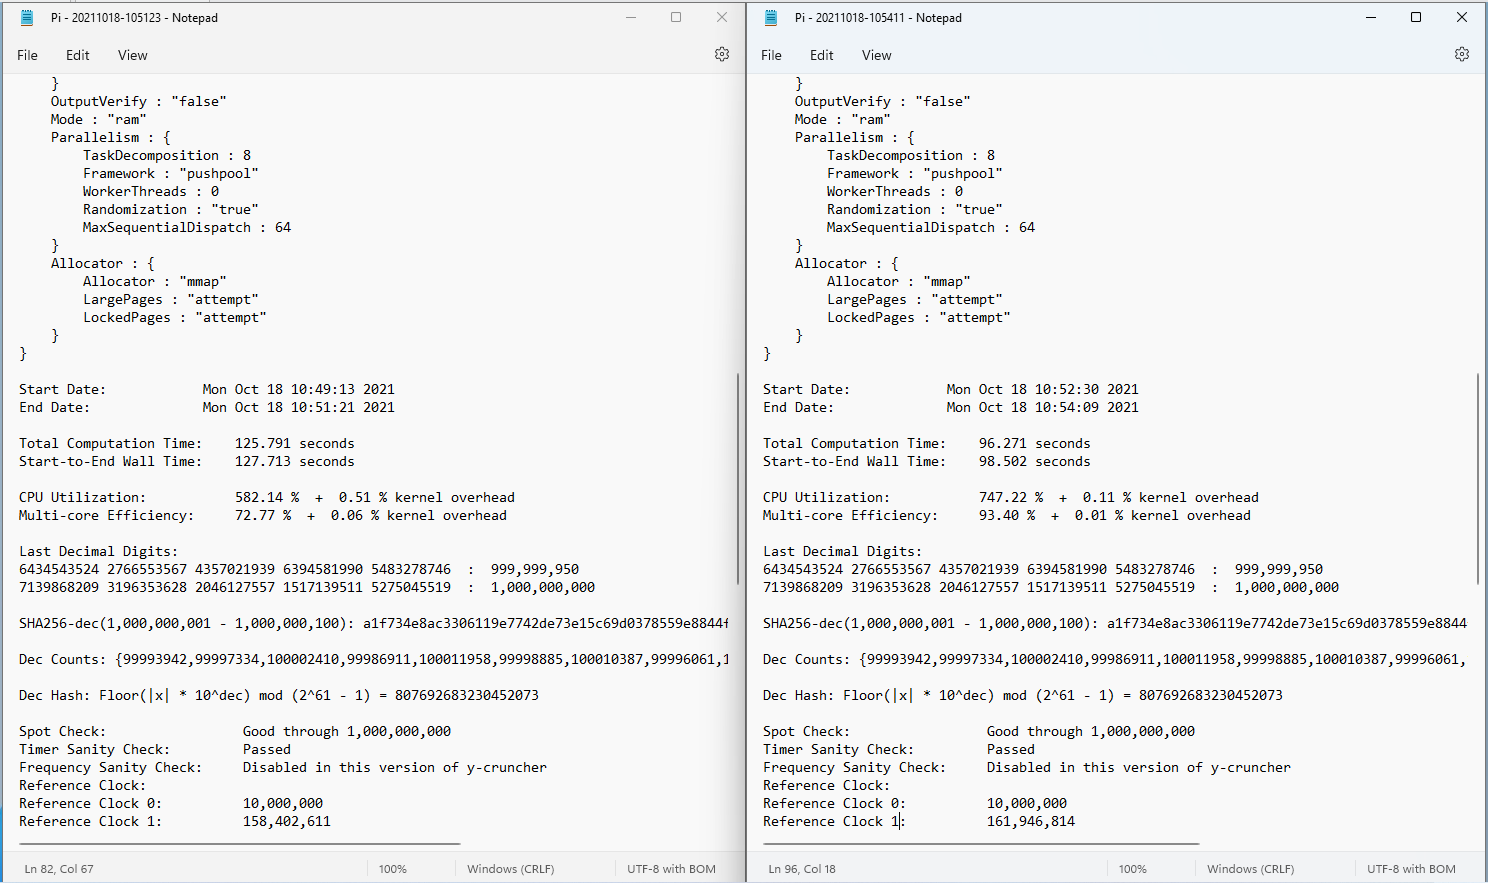
In order to test how well Speed Booster improves the performance of applications, we used a Pi benchmarking tool to measure results before and after applying the tweaks to a computer that was running applications and processes found on an average PC. The resulting difference in Pi calculation speed was an impressive 22.9% (127.713 seconds before the boost and 98.502 seconds after).
This Pi calculation is a great example of a multithreaded application so this test demonstrates what results to expect from Speed Booster with other multithreaded applications.
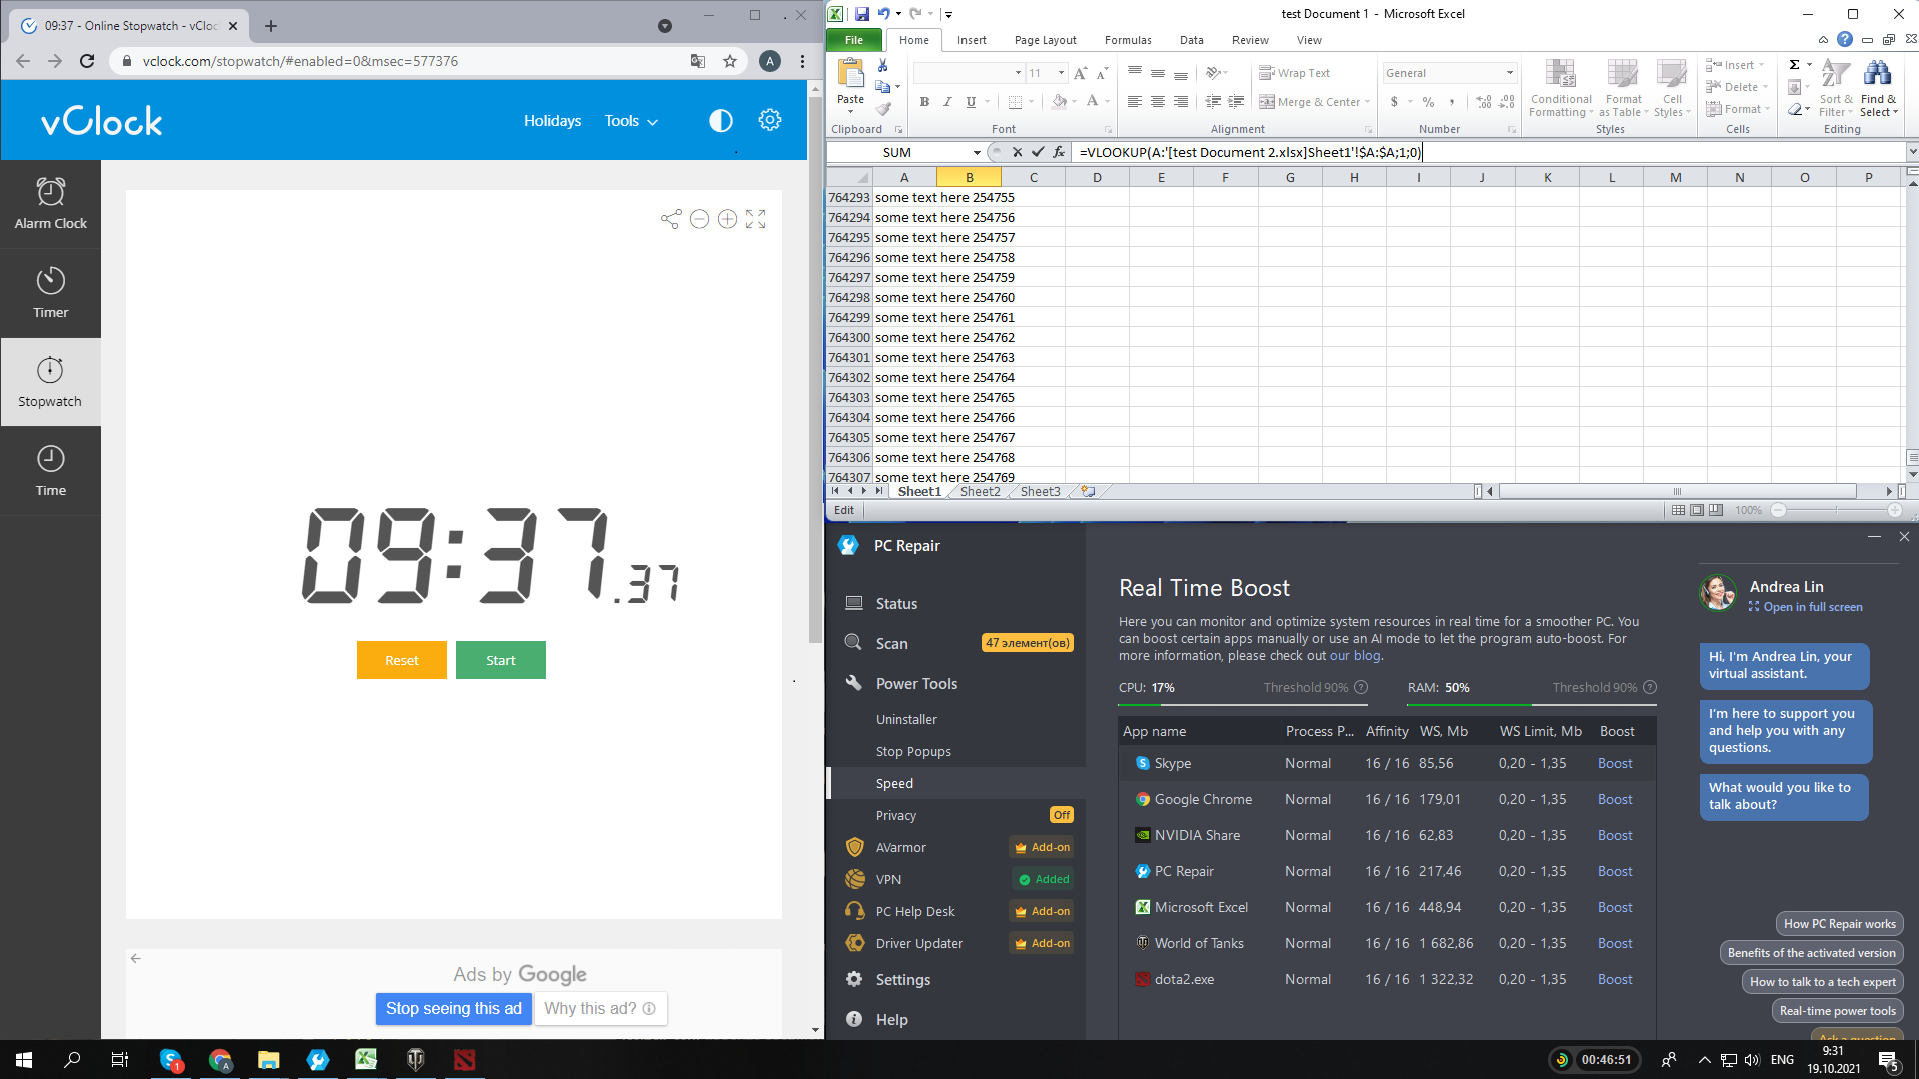
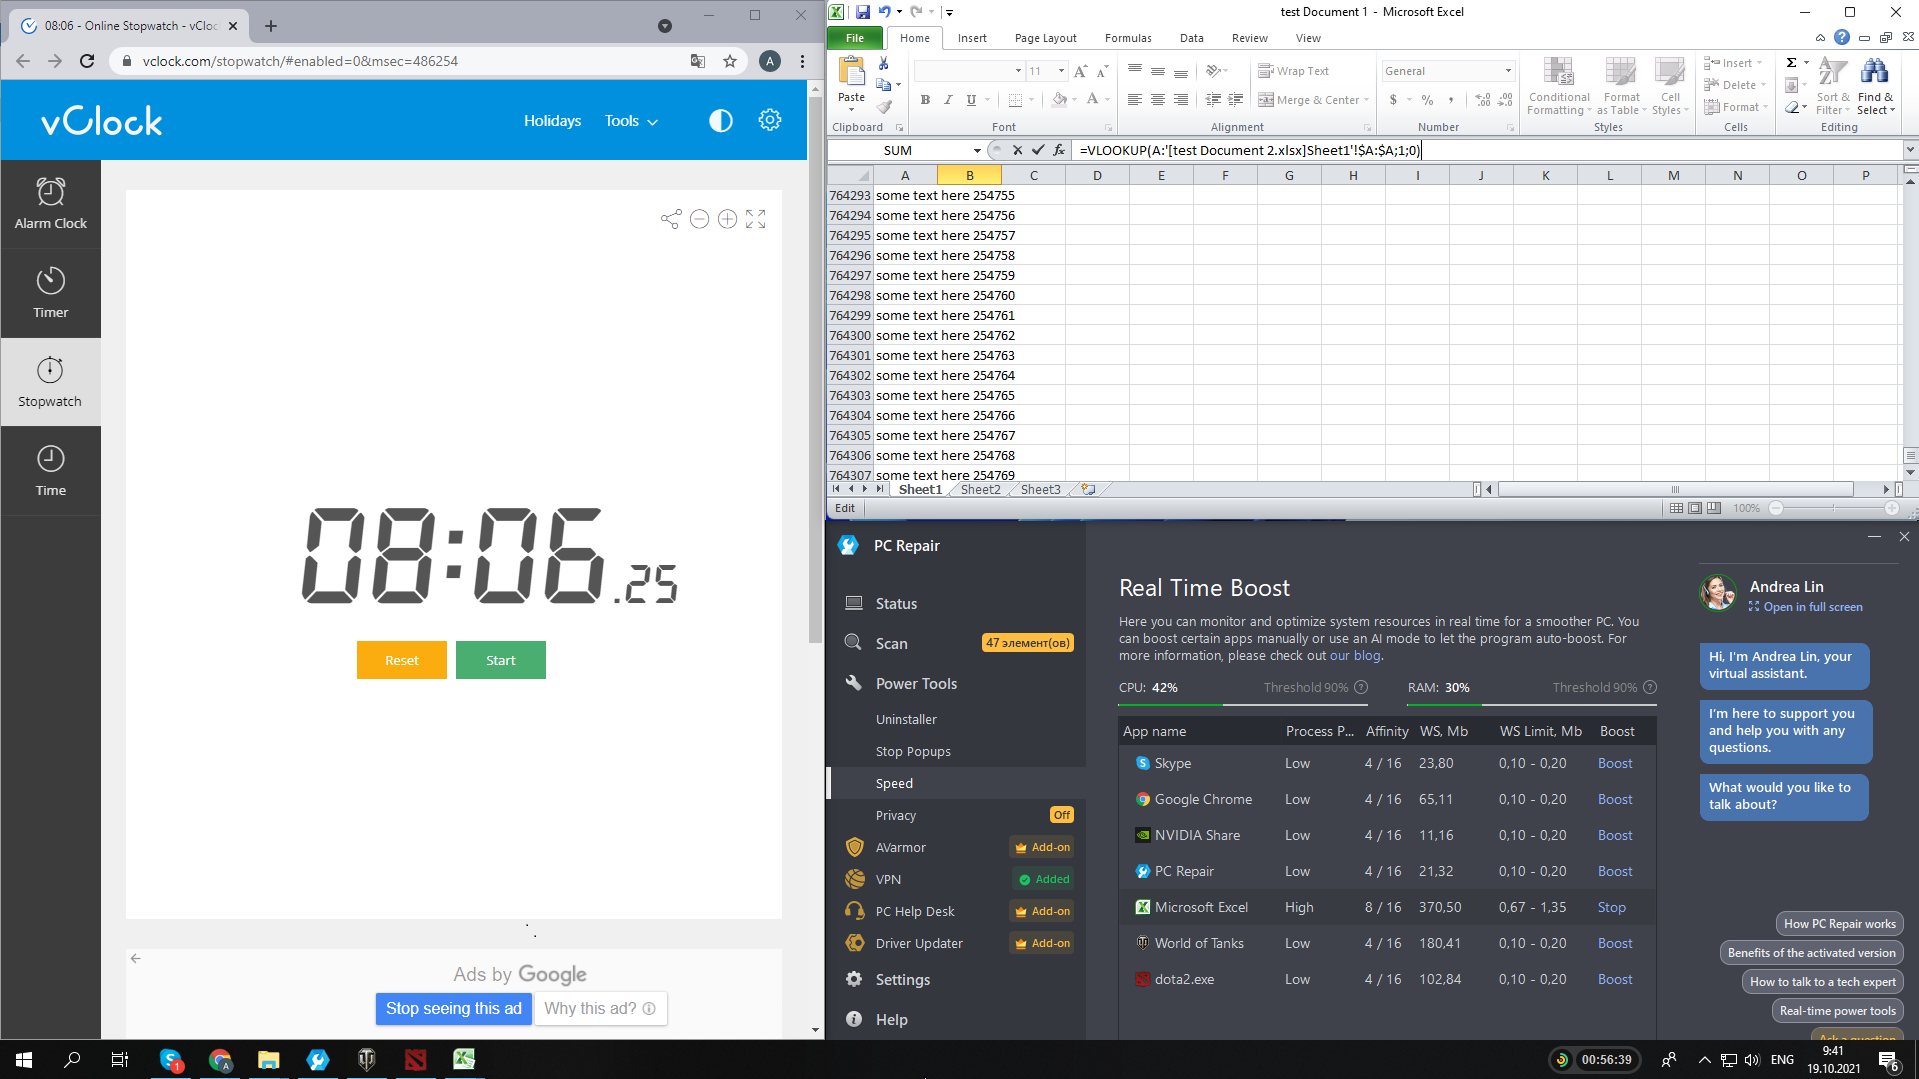
Another reliable method of testing a computer’s performance speed is running the VLOOKUP feature in MS Excel. This useful feature allows users to use complex criteria to search through Excel documents for specific data. If a PC is already running many processes, VLOOKUP may take a lot longer to complete a search.
We ran VLOOKUP on an Excel document containing several columns of data before and after activating Speed Booster. The operation went 15.7% faster with the tweaks applied for the process to be prioritized: 8 min 6 seconds after the boost compared to 9 minutes 37 seconds before it.
BEFORE:
AFTER:
Conclusion
In conclusion, we have determined that the limits of CPU power can slow down processes and make applications run slower. However, some processes are given higher priority by default and will always run better even if the CPU is loaded to a high capacity.
For software developers, this knowledge can be beneficial in making sure they design software that does not have too many processes set to high priority, to ensure that it does not overwhelm the CPU and runs smoothly.
This priority system can also be utilized by software designed to optimize performance as it can change priority settings. This can allow the applications that are needed by the user at the time run as smoothly as possible.
We tested this idea with the Speed Booster feature in Outbyte PC Repair, which uses this method of changing priority settings. The results of the tests demonstrated that it was very effective, improving the speed of processes by 15-22%. This shows that this type of tool can be very useful for all kinds of PC users who would prefer to improve performance without upgrading their hardware.
References
[1] Russinovich, M. E., & Margosis, A. (2016). Troubleshooting with the windows Sysinternals tools. Microsoft Press.
[2] Eilam, E. (2005). Reversing: Secrets of reverse engineering. John Wiley & Sons.
[3] Russinovich, M. E., Solomon, D. A., & Ionescu, A. (2012). Windows internals. Pearson Education. Pages 411-447
[4] Ghuman, S. S. (2016). Comparison of Single-Core and Multi-Core Processor. International Journal of Advanced Research in Computer Science and Software Engineering, 6(6).


